July 2023 Demographic Data
Benioff Children's Hospitals combined Oakland and San Francisco
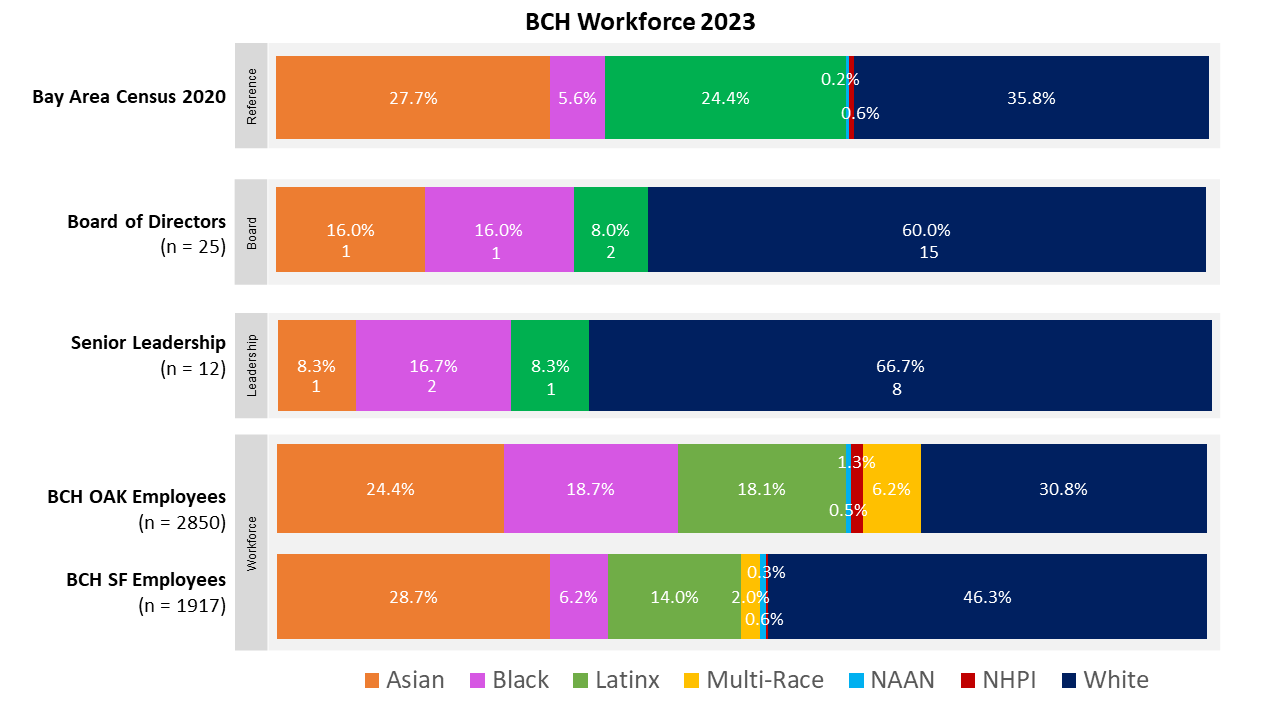
In total, there are 25 Board Members, 12 Senior Leadership, and 4767 employees in both BCH Oakland and San Francisco campuses. We compare the race/ethnicity of our BCH workforce with the Bay Area Census 2020.
Race/Ethnicity includes: Asian, Black, Latinx, Multi-Race, Native American/Alaska Native (NAAN), Native Hawaiian/Pacific Islanders (NHPI) and White.
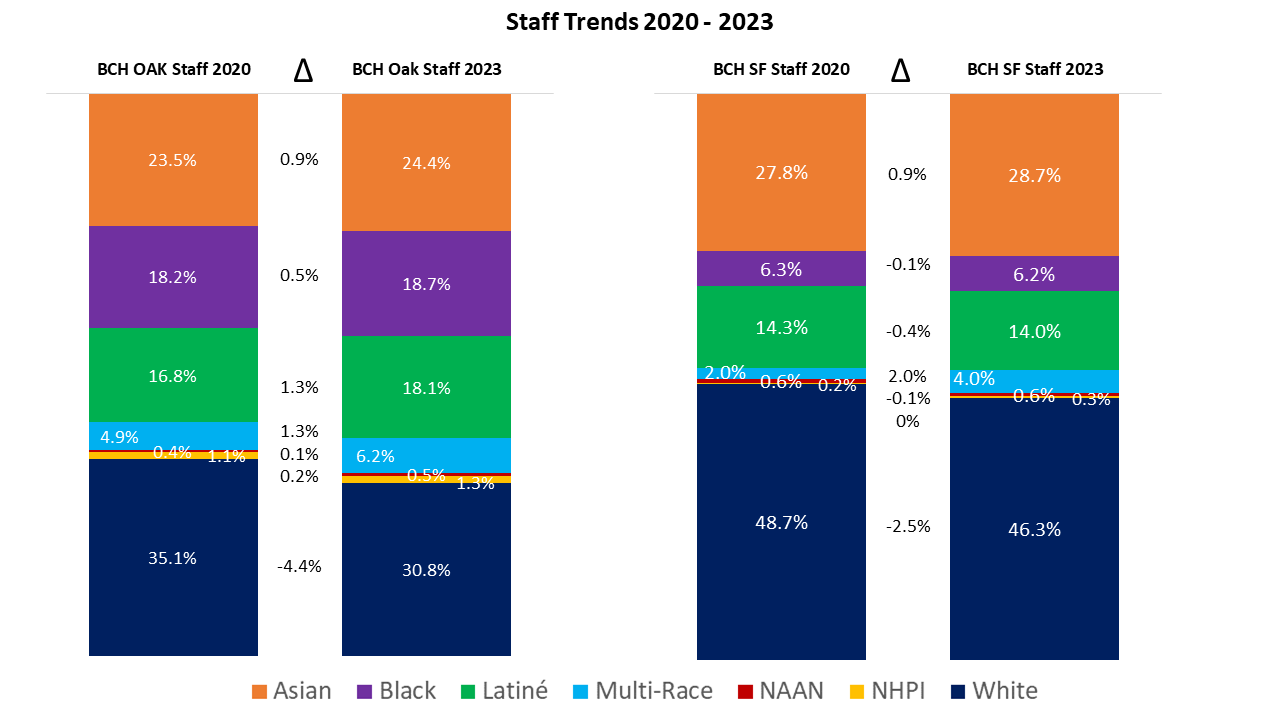
Comparison of the percentage of staff by race/ethnicity in 2020 and 2023.
Benioff Children's Hospitals Oakland
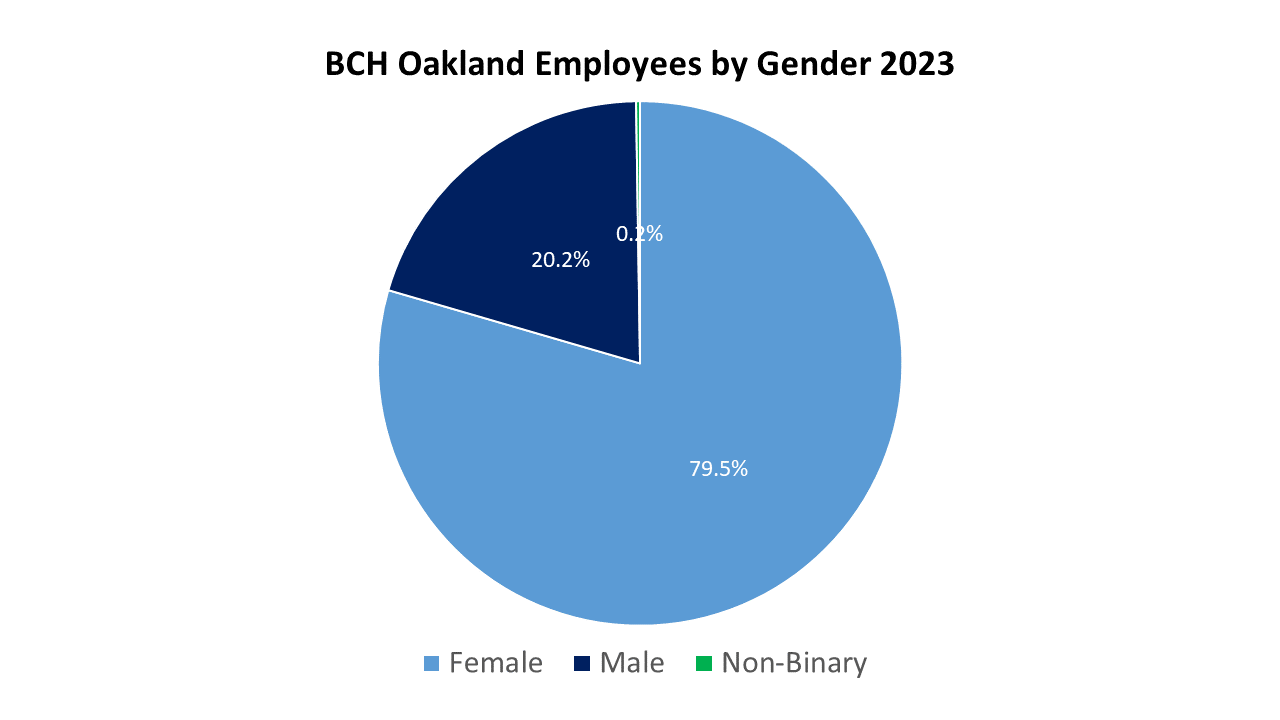
In total, there are 2850 employees at BCH Oakland:
- 2266 (79.5%) Female Employees
- 577 (20.2%) Male Employees
- 7 (0.2%) Non-Binary Employees
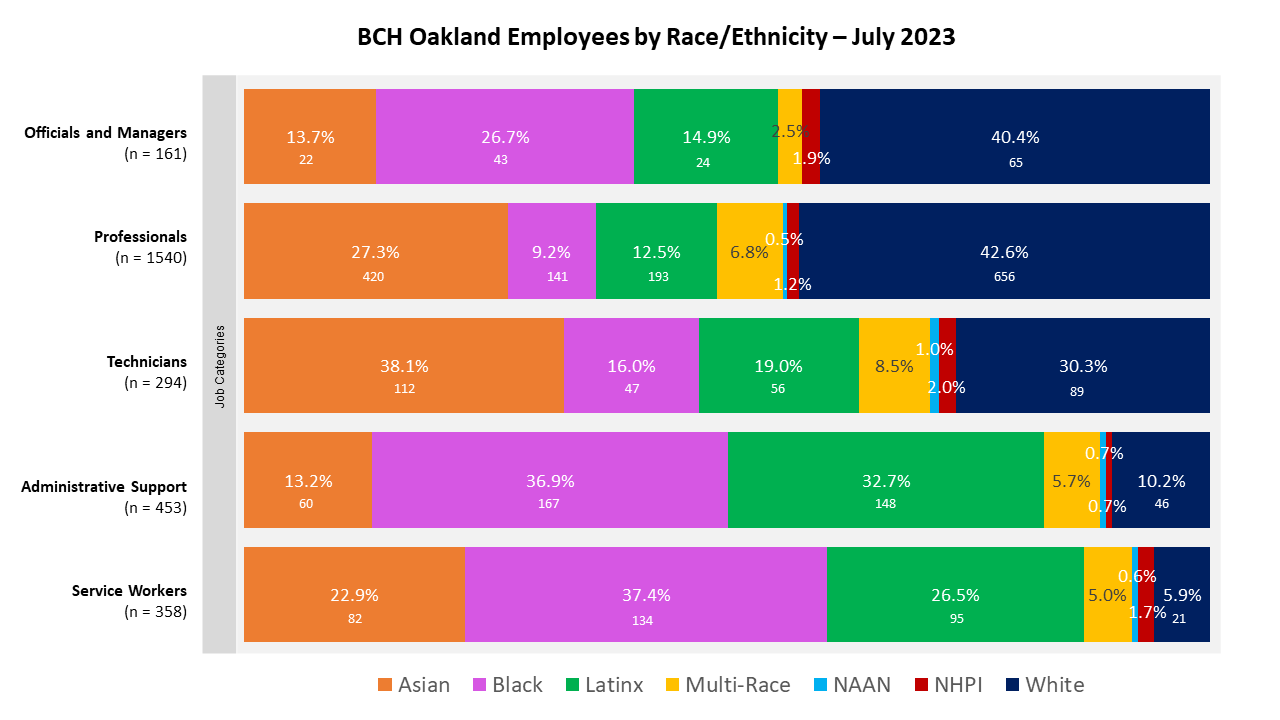
By race/ethnicity for BCH Oakland Employees:
- 696 (24.4%) Asian
- 532 (18.7%) Black
- 516 (18.1%) Latinx
- 15 (0.5%) Native American/Alaska Native (NAAN)
- 37 (1.3%) Native Hawaiian/Pacific Islander (NHPI)
- 177 (6.2%) Other
- 877 (30.8%) White
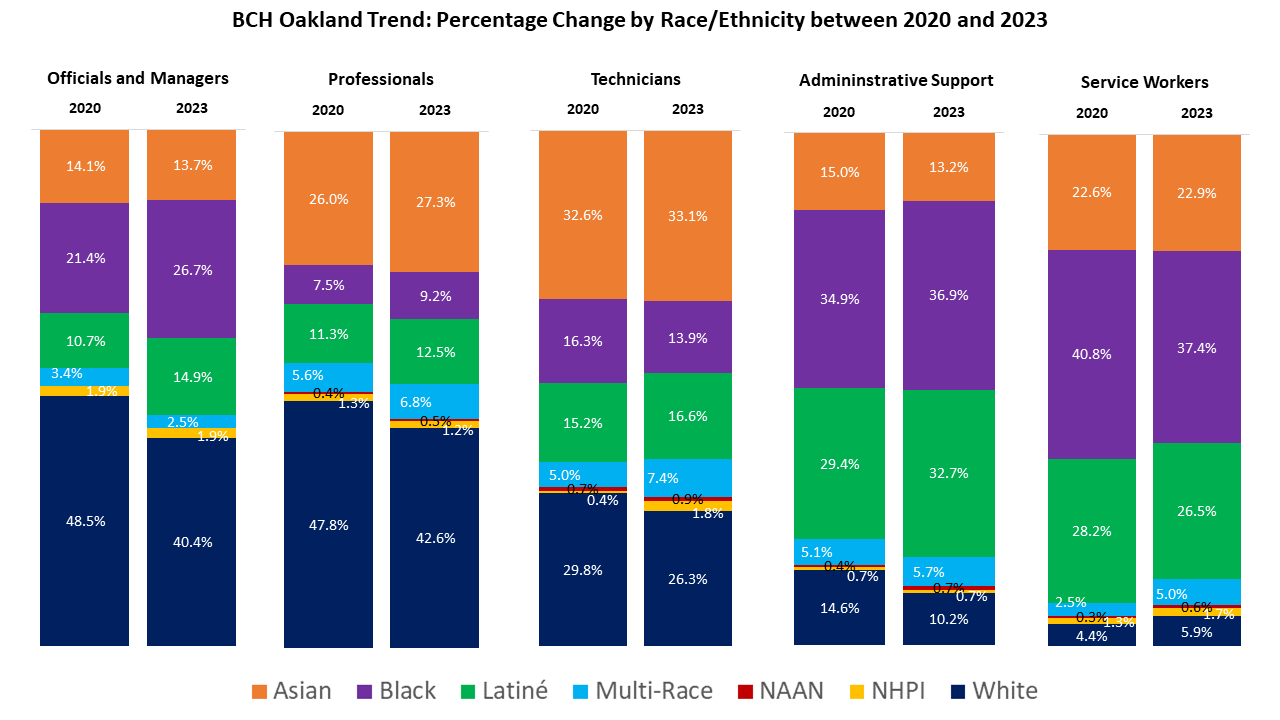
Comparison of the percentage of BCH Oakland staff by race/ethnicity in 2020 and 2023.
Benioff Children's Hospitals San Francisco
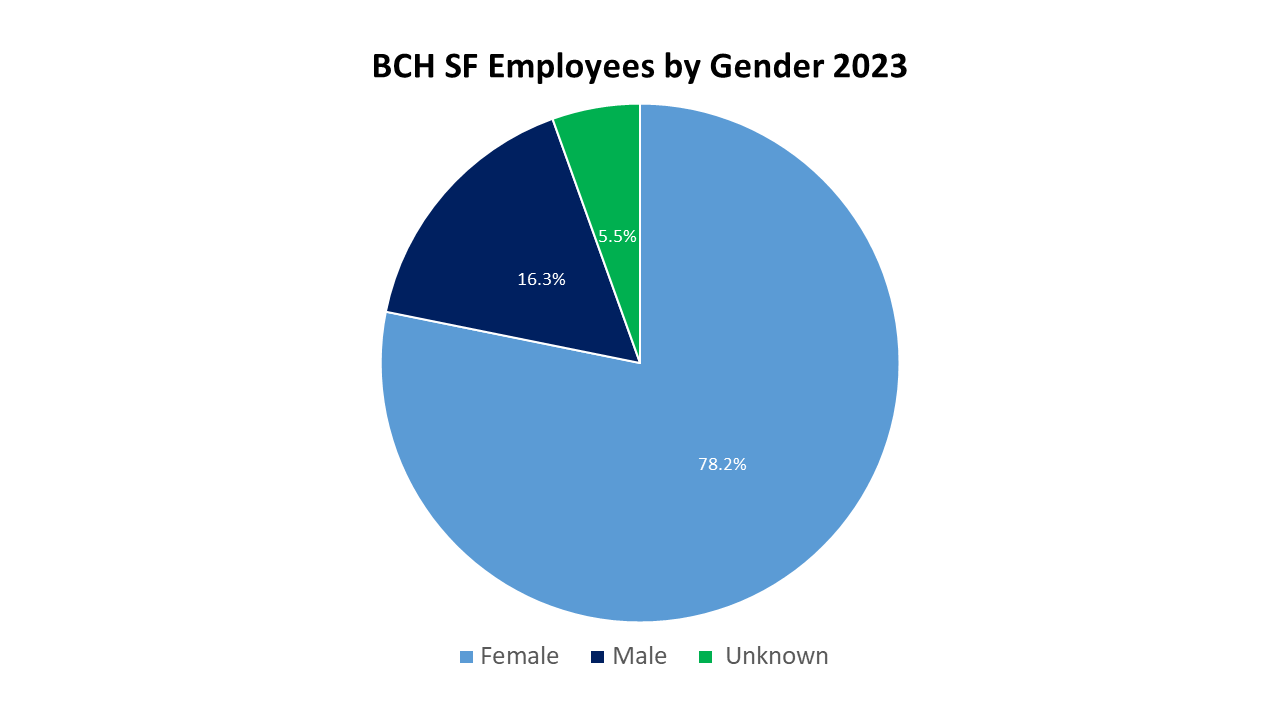
In total, there are 1915 employees at BCH San Francisco:
- 1497 (78.2%) Female
- 313 (16.3%) Male
- 105 (5.5%) Unknown
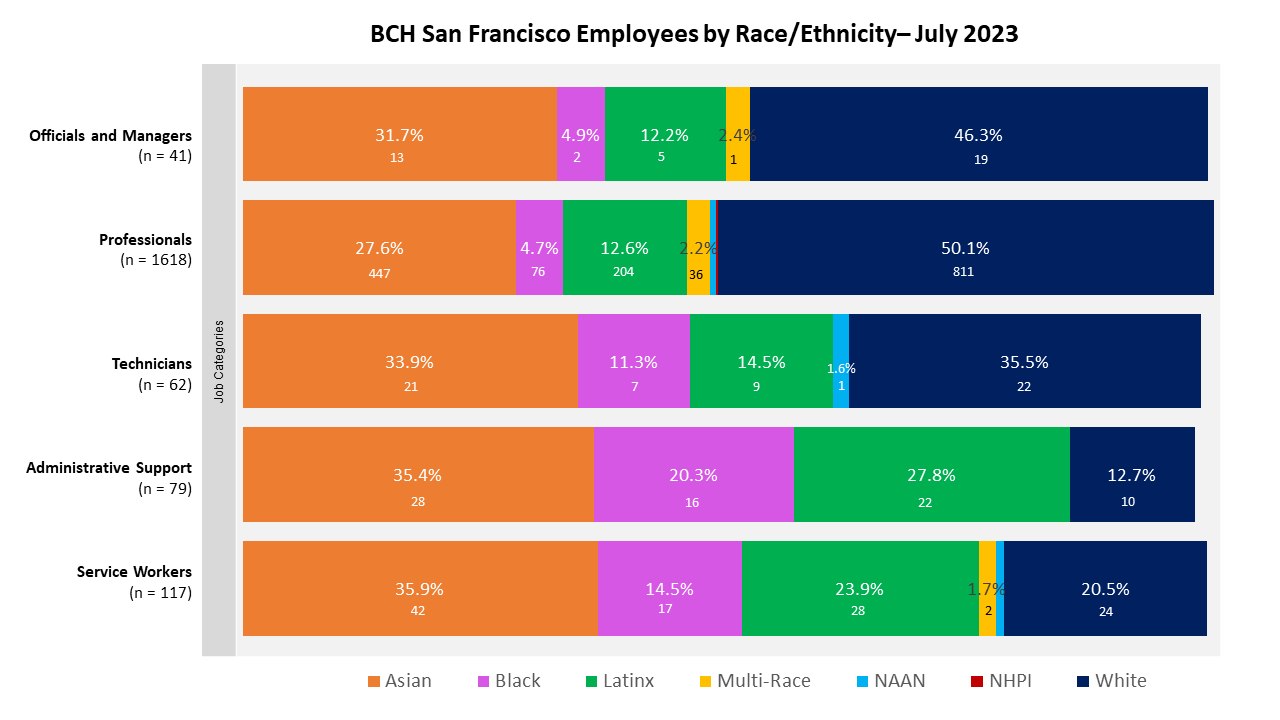
By race/ethnicity for BCH San Francisco employees:
- 551 (28.7%) Asian
- 118 (6.2%) Black
- 268 (14.0%) Latinx
- 11 (0.6%) Native American/Alaska Native (NAAN)
- 5 (0.3%) Native Hawaiian/Pacific Islander (NHPI)
- 38 (2.0%) Other
- 887 (46.3%) White
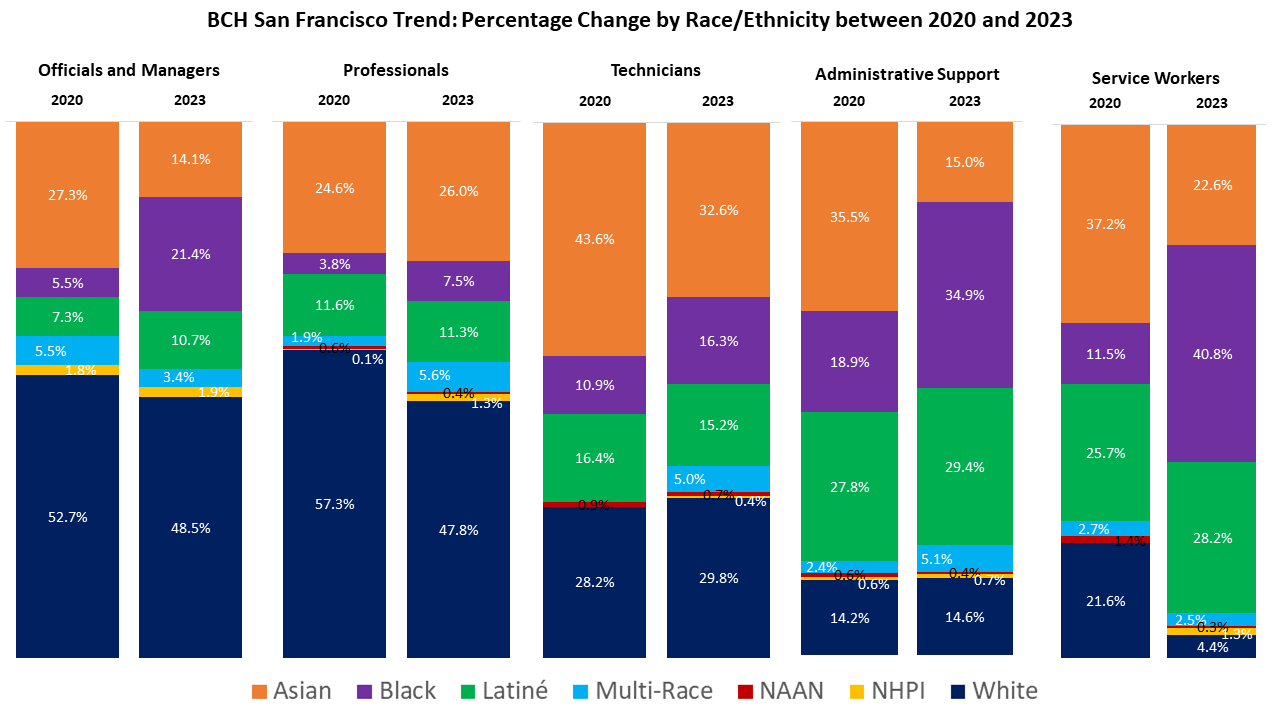
Comparison of the percentage of BCH San Francisco staff by race/ethnicity in 2020 and 2023.